Contents
Goals
- introduction into algorithmic decision making with the help of personal data
- exploring rights-related implications, bias and norm setting
Context
Categorisation of people, automated identification of what is relevant and important, clustering people on the basis of their data - these are all an ambiguous feature of AI-driven platforms.
On the one hand, our data and the algorithms behind the platforms create an intuitive user experience and help us to build networks, to access more easily what might be interesting for us or to optimise our routines.
On the other hand, the algorithms present us a picture of our digital life, which is influenced by the platforms and their (automated) decisions.
Like any other cultural practice, computer mediated collaboration and communication sets norms and rules for human interaction. The following practice illustrates how AI judges a face using picture detection. Similar ‘norming’ applications of AI are related to the picture algorithms in social media. They might identify harmful and violent content and keep it away from us. They might filter out pictures that we probably want to see, or they might feature pictures that we should be presented for other reasons. A dystopic example is the Chinese social scoring system, which not only strongly manipulates the appearance of social reality in digital spaces, but also enforces a conformist behaviour via digital means.
The more AI and the platforms that own the code make choices that affect what their users perceive as ‘normal’, the more users need tools to reflect on how normal the algorithms suggested to them really are.
Steps
1. Introduction: Explain the concept of “How normal am I”.
How Normal am I
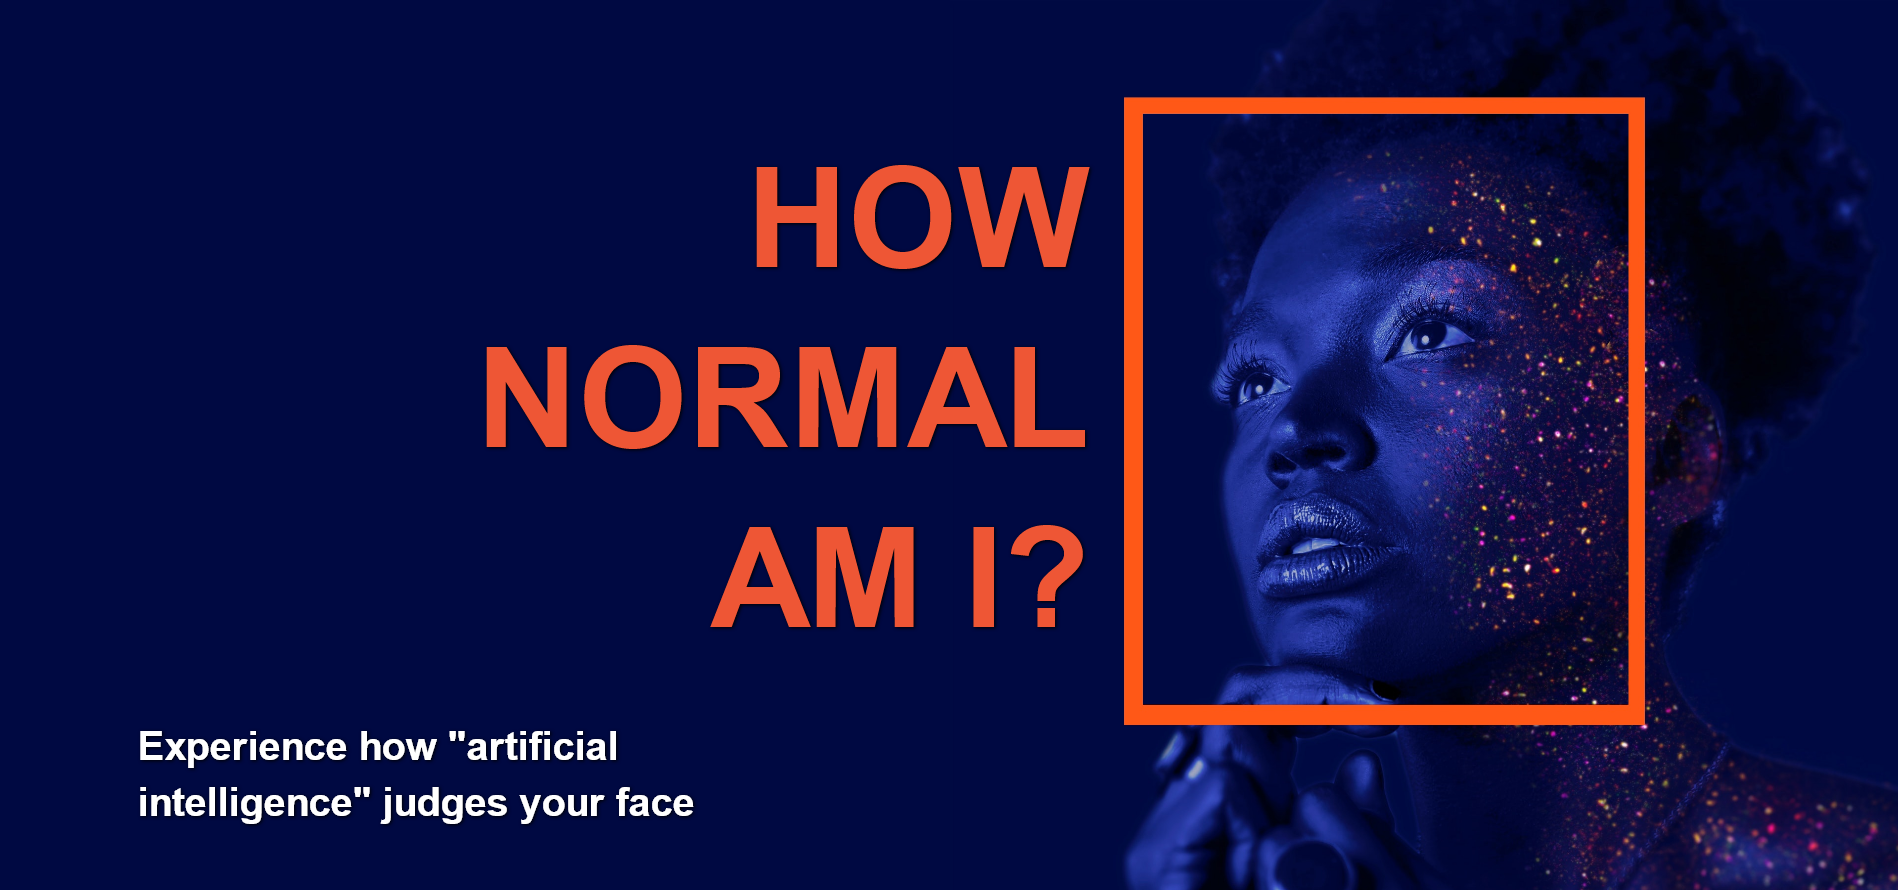
On the website from Tijmen Schep, “How Normal am I?”, experience how artificial intelligence draws conclusions by just judging your face. AI will assess your beauty, age, life expectancy, body mass index and even emotional state. During this task, you will learn about the underlying technology and how it comes to its conclusions. The tool was developed in the frame of the Sherpa project.
2. Let the participants access the website individually. Ask them to store the results, by making screenshots or copying the information.
Hint: The results could trigger participants emotionally, especially because they are based also on assessments of body characteristics. Faciltators should make this transparent: The systems are not based on objective norms, nor creating valid results. They are creating outputs by using very simple automatised models. Exchange among participants must be voluntary. Nobody should be pushed in a situation where they feel obliged to share something what they don't want to share.
3. Sociometry: Ask participants to sort themselves on a line based on their normality score. One end of the line represents the lowest score, the other the highest.
You might explain that the popular sociometry method has some similarities with what machines do. It creates additional information through the agglomeration of many data. In this case, you can see how normal you are as a group, and how normality is distributed among participants.
- More about Sociometry
4. Smaller group discussion about the method and the results: If you have the impression that the work with the results is too challenging for the participants one solution could be to work with profiles of other people.
- What do you conclude from this assessment?
- What was surprising for you?
- If you want to, compare your results.
- Any questions arising from this experience? Anything you would like to share?
5. Topical and technical aspects - continue in the same groups.
- Remember how the system came to its interpretations.
- What technology was new to you?
- What would you like to learn more?
6. Prepare a poster with
- your most urgent questions regarding the way people are measured and profiled (up to three)
- two numbers: your average age as predicted by the AI (count all predicted ages together and divide them by your number) and your actual average age
- optionally: notice the technologies you would like to find out more about
You may notice that the predicted age does not match reality. One solution to correct this machine-made mistake would be to simply collect more data. In theory, the average data of your predicted ages together should be nearly the same as the average of your real ages. If not, this could be a hint that the algorithm is not working properly.
Reflection
Plenary: At the beginning of the reflection portion, each group shares their most urgent three questions on the poster.
- What conclusions do you as a user draw from this experiment in regard to this kind of digital technology?
- What issues arise from a Human Rights and Democracy perspective?
- How would you like to move forward with the topic?
Becoming more average
“Profiling systems may incentivise us to be as average as possible”
Schep, 2020).
Reference
- Tijmen Schep How Normal am I?
Nils-Eyk Zimmermann
Editor of Competendo. He writes and works on the topics: active citizenship, civil society, digital transformation, non-formal and lifelong learning, capacity building. Coordinator of European projects, in example DIGIT-AL Digital Transformation in Adult Learning for Active Citizenship, DARE network.
Blogs here: Blog: Civil Resilience.
Email: nils.zimmermann@dare-network.eu
Georg Pirker
Person responsible for international relations at the Association of German Educational Organizations (AdB), president of DARE network.
Experience
This practice might be used as an entry to the topic of biometric identification and biometric analysis.
It might also facilitate a debate about how algorithms and their application influence social norms.
Variation
During the session, an individual face profile will be presented. Ask participants to save it. It might be used as an alternative gallery of participants. You might print these out and compare what machines see and what humans see.


